Coppock Curve
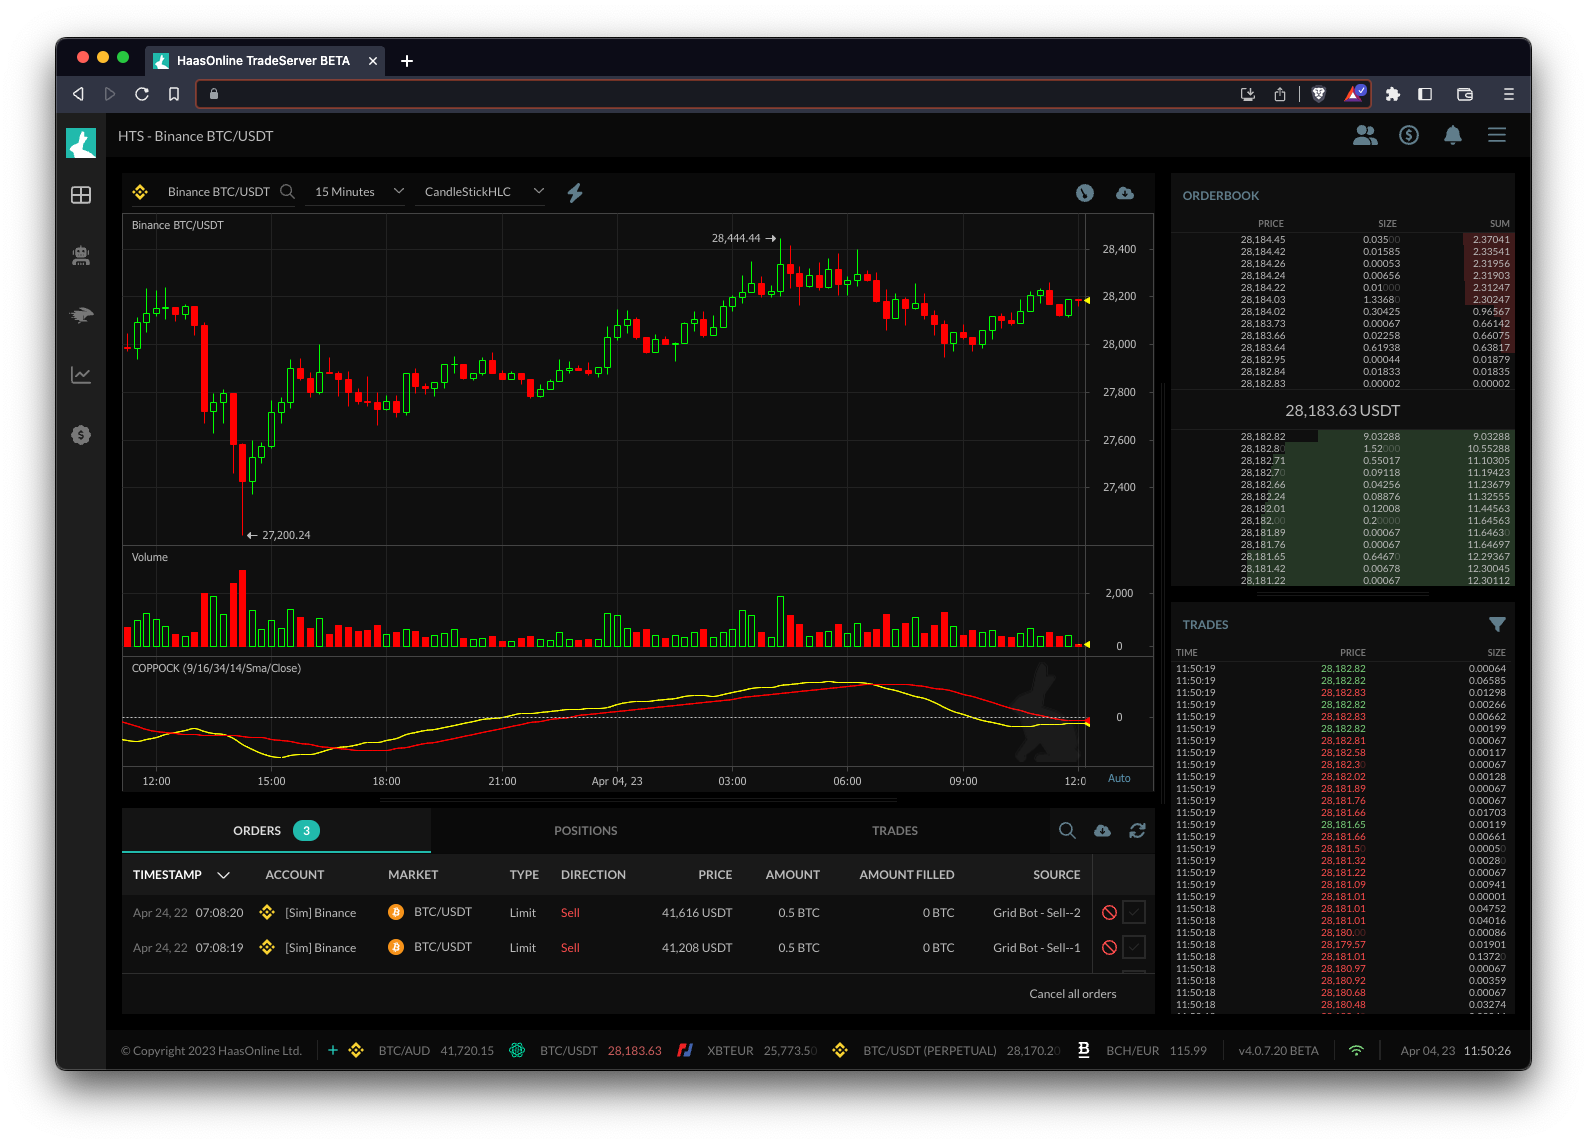
The Coppock Curve is a technical indicator used in trading to identify long-term buying opportunities in the stock market. It was developed by Edwin Coppock, a stock market analyst, and published in Barron’s Magazine in 1962. The Coppock Curve is calculated by adding the 11-period and 14-period rate of change values, and then smoothing the result with a 10-period weighted moving average.
The indicator is designed to identify buying opportunities at the bottom of bear markets, when momentum is shifting from negative to positive. A bullish signal is generated when the Coppock Curve crosses above zero from negative territory. Traders may use this signal to enter long positions or to add to existing long positions.
The Coppock Curve is not frequently used in crypto trading, but it can be used in a similar manner to identify long-term buying opportunities in the cryptocurrencyCryptocurrency is a digital or virtual currency that uses cryptography for security and operates independently of a central bank. Cryptocurrencies use decentralized technology called blockchain... market. Trading bots like HaasOnline can be programmed to analyze the Coppock Curve and execute trades based on the generated signals.


