Let’s create something similar but allows you to have more flexibility.
- Script Setup:
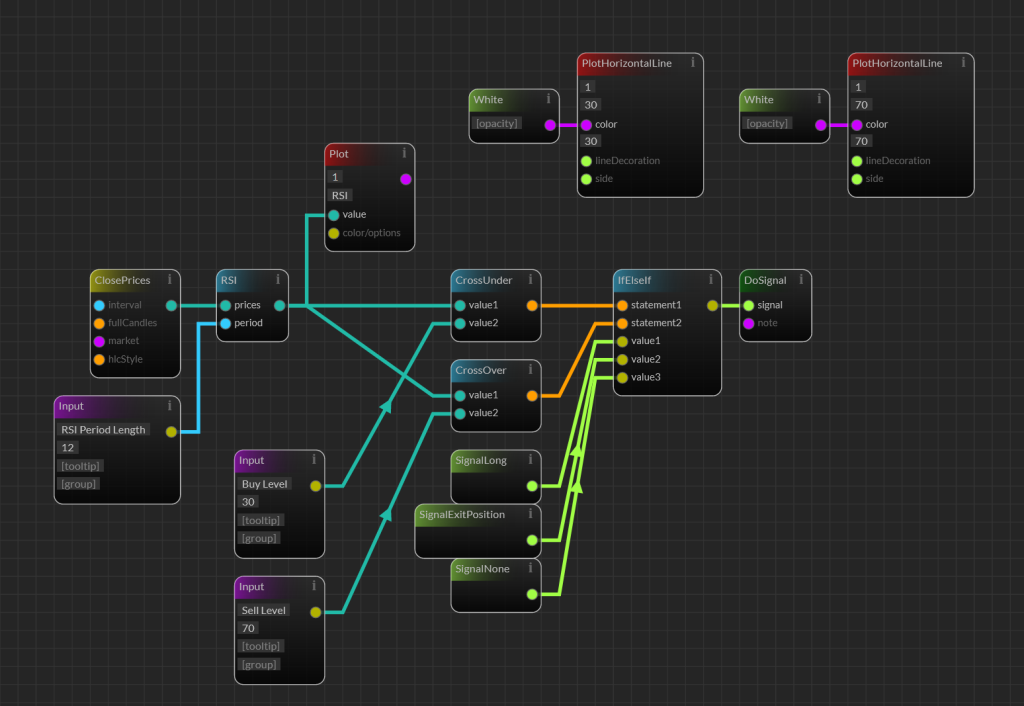
- Create a new script and add the following foundational blocks:
- ‘ClosePrices’
- ‘RSI’
- ‘Input’
- ‘Plot’
- ‘PlotHorizontalLine’
- ‘White’
- Pro Tip: For guidance on what each block does, hover over the “I” icon for a brief description.
- Create a new script and add the following foundational blocks:
- Visualizing RSI:
- Arrange and link the blocks as demonstrated below.
- Save and run your script to visualize the 12-period RSI with two white horizontal lines at 30 and 70, indicating potential overbought and oversold levels.
- ChartID ‘1’ will place this visualization in the first inner window below the main chart.

Now let’s get the rest of the blocks.
- Adding Complexity:
- Now, let’s introduce additional blocks to refine our bot’s logic:
- ‘CrossUnder’
- ‘CrossOver’
- ‘Input’
- ‘SignalLong’
- ‘SignalExitPosition’
- ‘SignalNone’
- ‘IfElseif’
- ‘DoSignal’
- Now, let’s introduce additional blocks to refine our bot’s logic:
- Linking New Blocks:
- Follow the layout in the provided image to connect these new elements.
- Save your script and execute it. You’ve now crafted a bot similar to the previous one, minus the two safeties and one insurance, allowing for greater script flexibility.
- Experimentation:
- Feel free to modify conditions. For instance, try adjusting the RSI levels to buy when crossing over 70 and sell when crossing under 30.
- Test out your adjusted conditions to see how they affect the bot’s behavior before checking the solution.
Wrapping Up
You’ve reached the end of the beginner’s tutorial. With the Visual Editor’s intuitive design, you can unleash your creativity to develop a bot that’s tailored to your strategy. Remember, the only limit to what you can create with Visual Editor is your imagination!