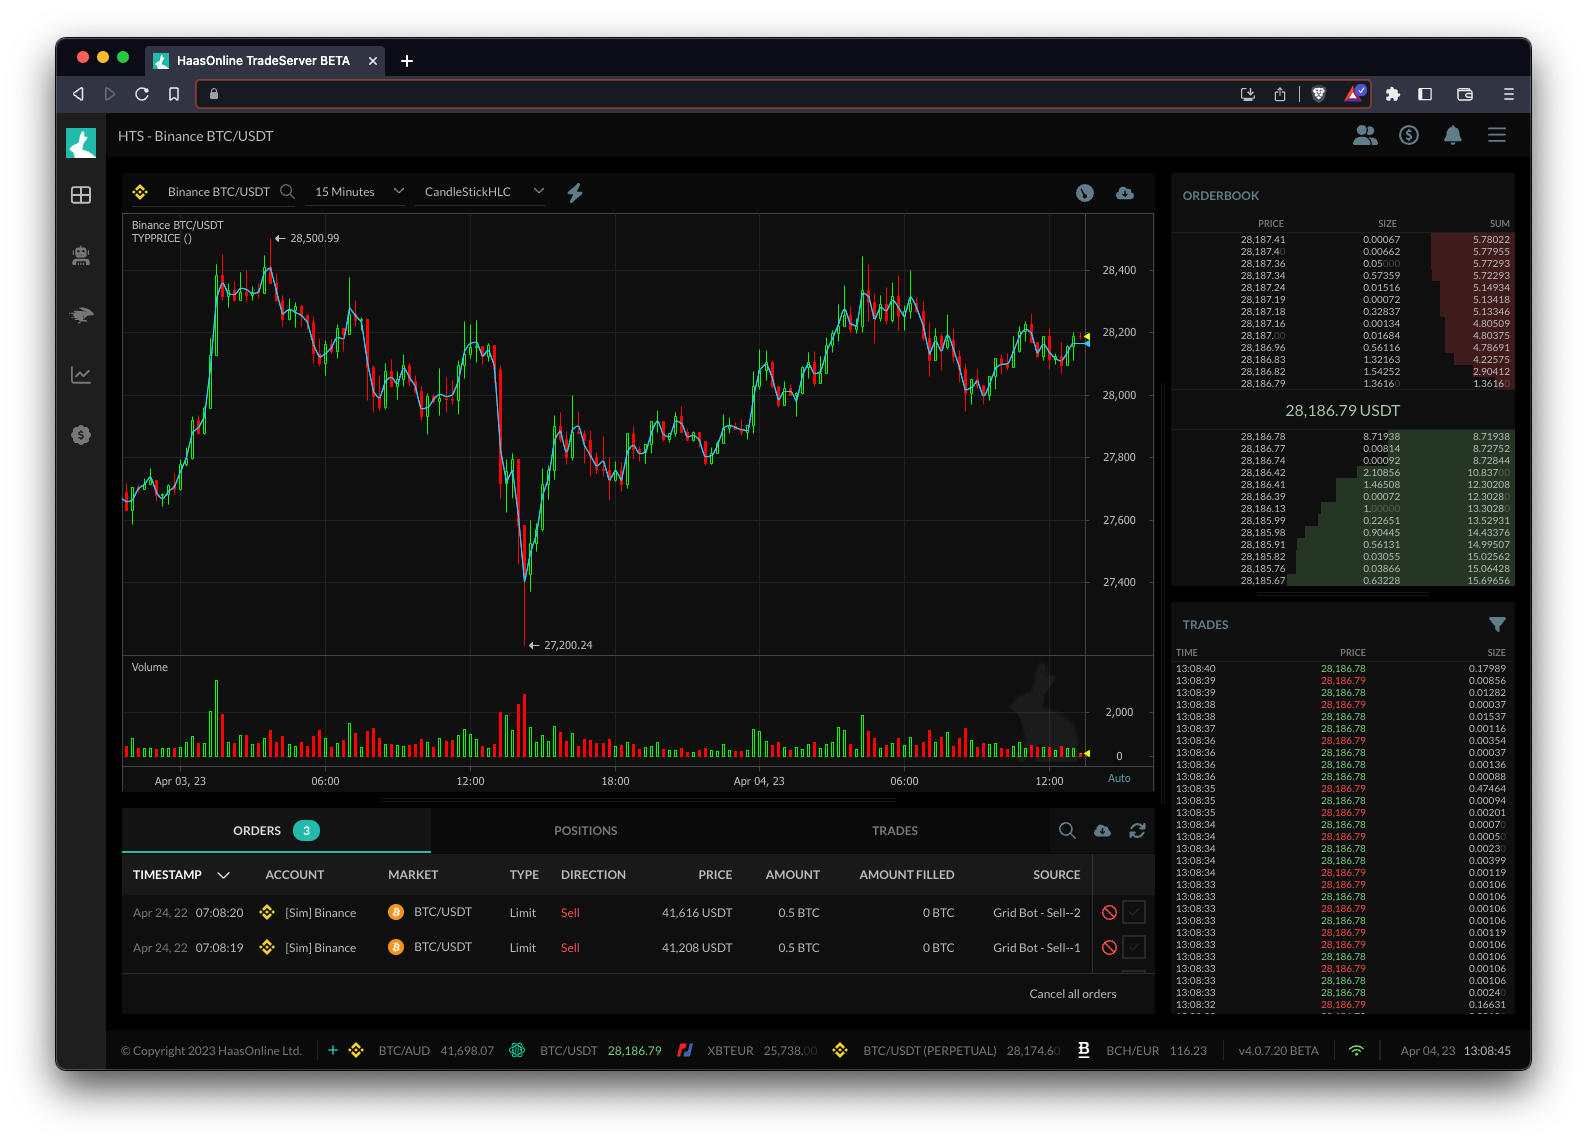
Typical Price
The Typical Price technical indicator is a price-based indicator that is calculated by adding the high, low, and close prices of an asset and then dividing the result by three. This calculation provides a single value that represents the average price of an asset over a given period of time. The Typical Price can be used with trading bots like HaasOnline to help identify trends and potential entry and exit points for trades.
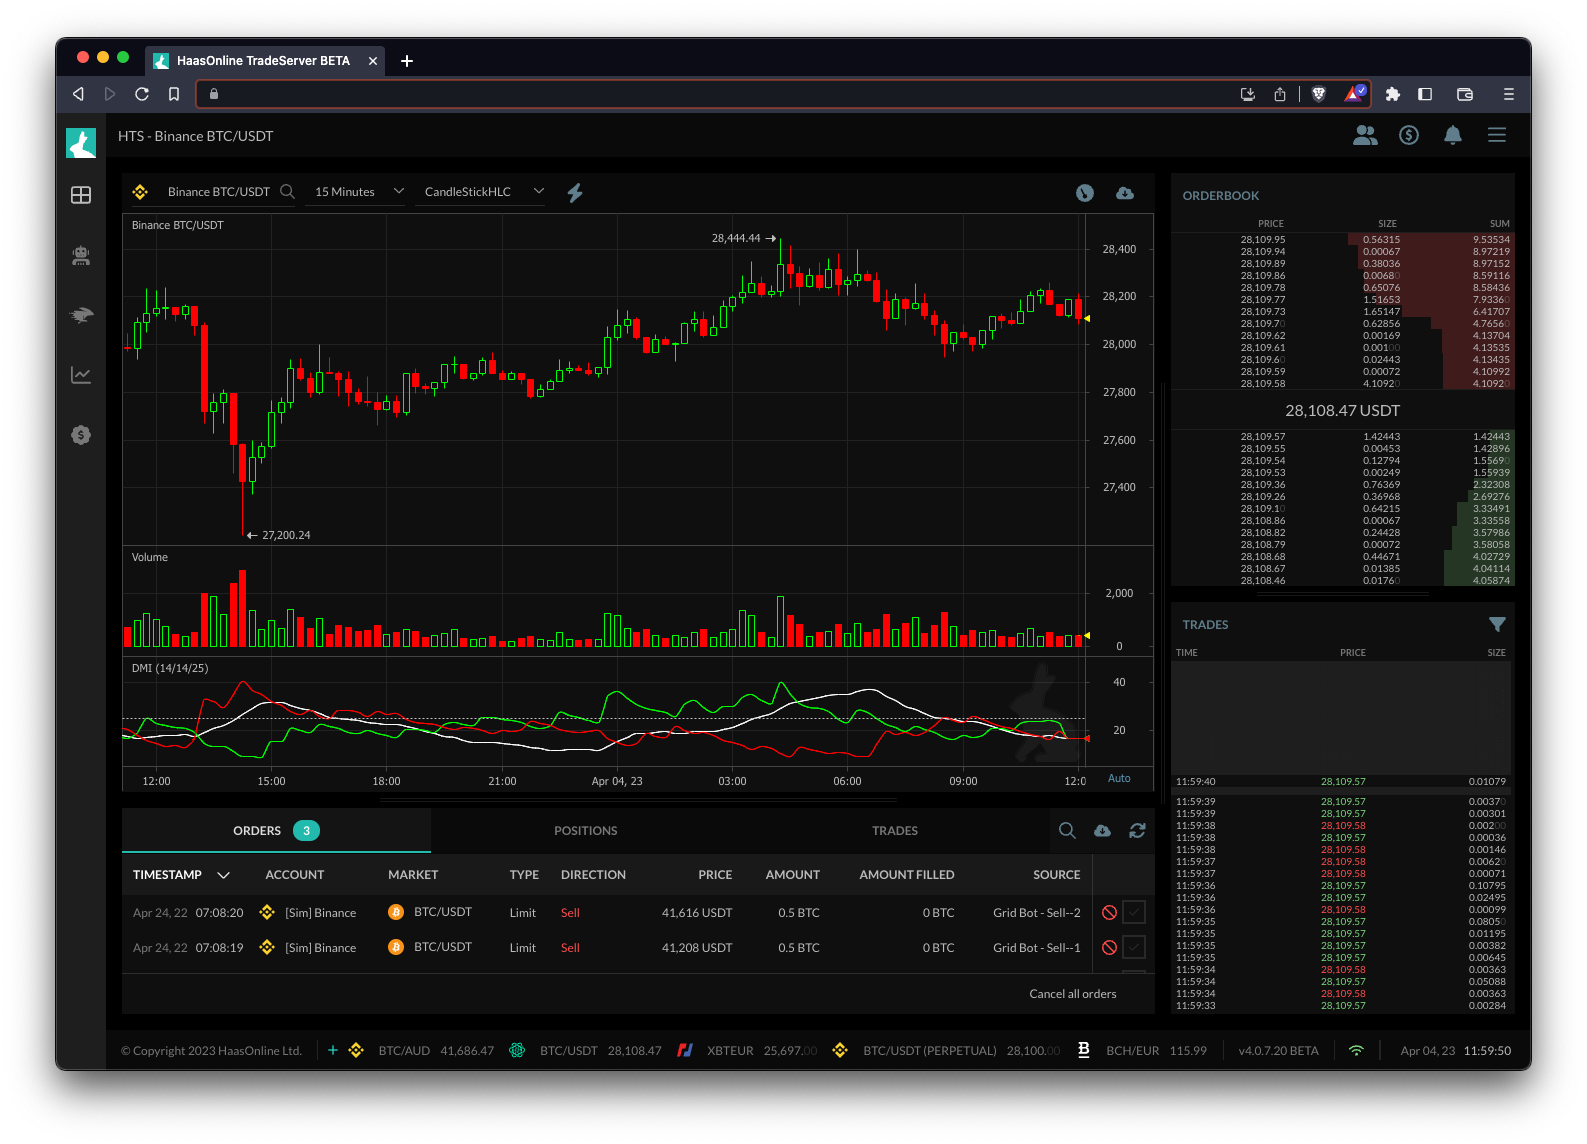
When using the Typical Price with a trading bot, it can be helpful to plot the indicator alongside other technical indicatorsTechnical indicators are mathematical calculations based on the price and/or volume of an asset. They are used to help traders identify market trends, momentum, and... or price charts to help confirm signals and identify potential trends. For example, a trader may use the Typical Price in combination with a moving average or Bollinger Bands to help identify trend changes and potential buy or sell signals.
In addition to using the Typical Price as a standalone indicator, traders may also use it in conjunction with other technical analysis tools and market data to help identify potential trading opportunities. For example, a trader may use the Typical Price alongside other indicators such as the Relative Strength IndexAn index related to cryptocurrency trading is a tool that is used to track the performance of a group of cryptocurrencies. It is designed to... (RSI) or Moving Average Convergence Divergence (MACD) to help identify potential overbought or oversold conditions, or to confirm trend signals.


