Simple Moving Average (SMA)
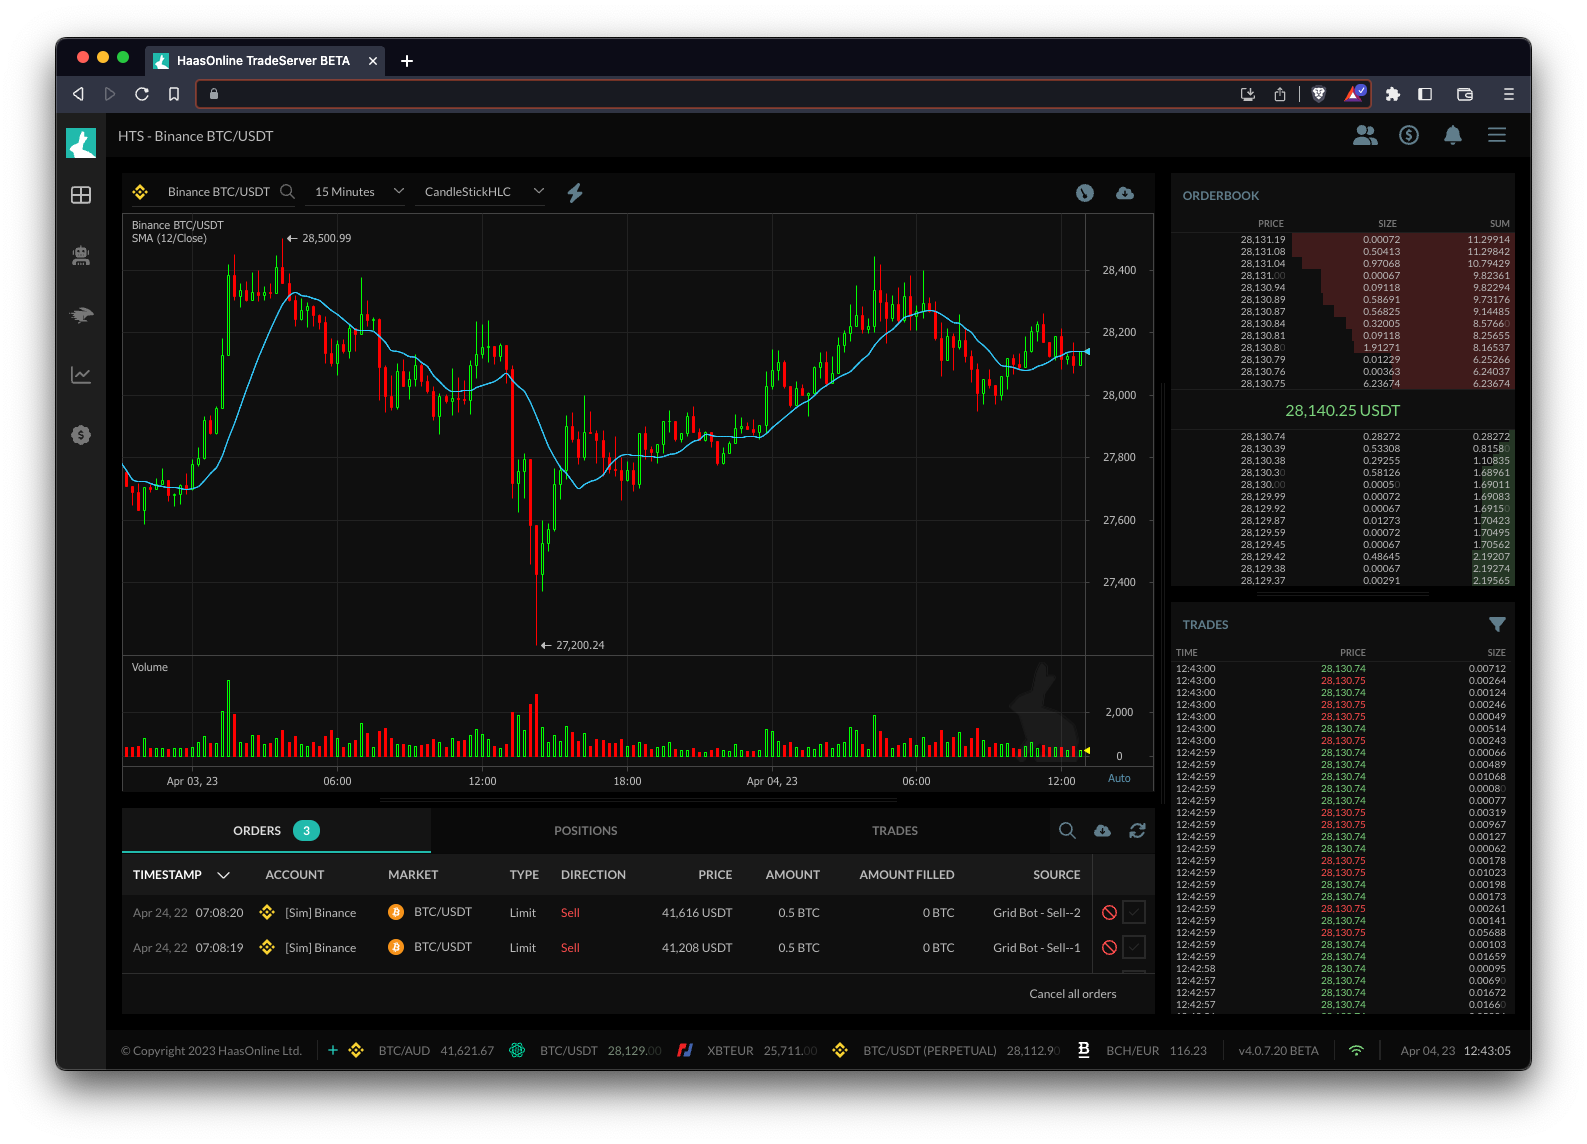
The Simple Moving Average (SMA) is a widely used technical indicator in trading that calculates the average price of an asset over a specified period of time. It is used to identify the direction of the trend and to determine supportIn technical analysis, a support line is a price level at which demand for an asset is thought to be strong enough to prevent the... and resistanceIn technical analysis, resistance refers to a level on a chart where there is significant selling pressure and the price of an asset struggles to... levels. In trading bots like HaasOnline, the SMA can be used to create trading strategies based on crossovers of the price and the moving average. For example, a trader may use a 50-day SMA and a 200-day SMA to identify a bullish or bearish trend, and execute buy or sell orders accordingly. Additionally, the SMA can be used in conjunction with other indicators to create more complex trading strategies.


