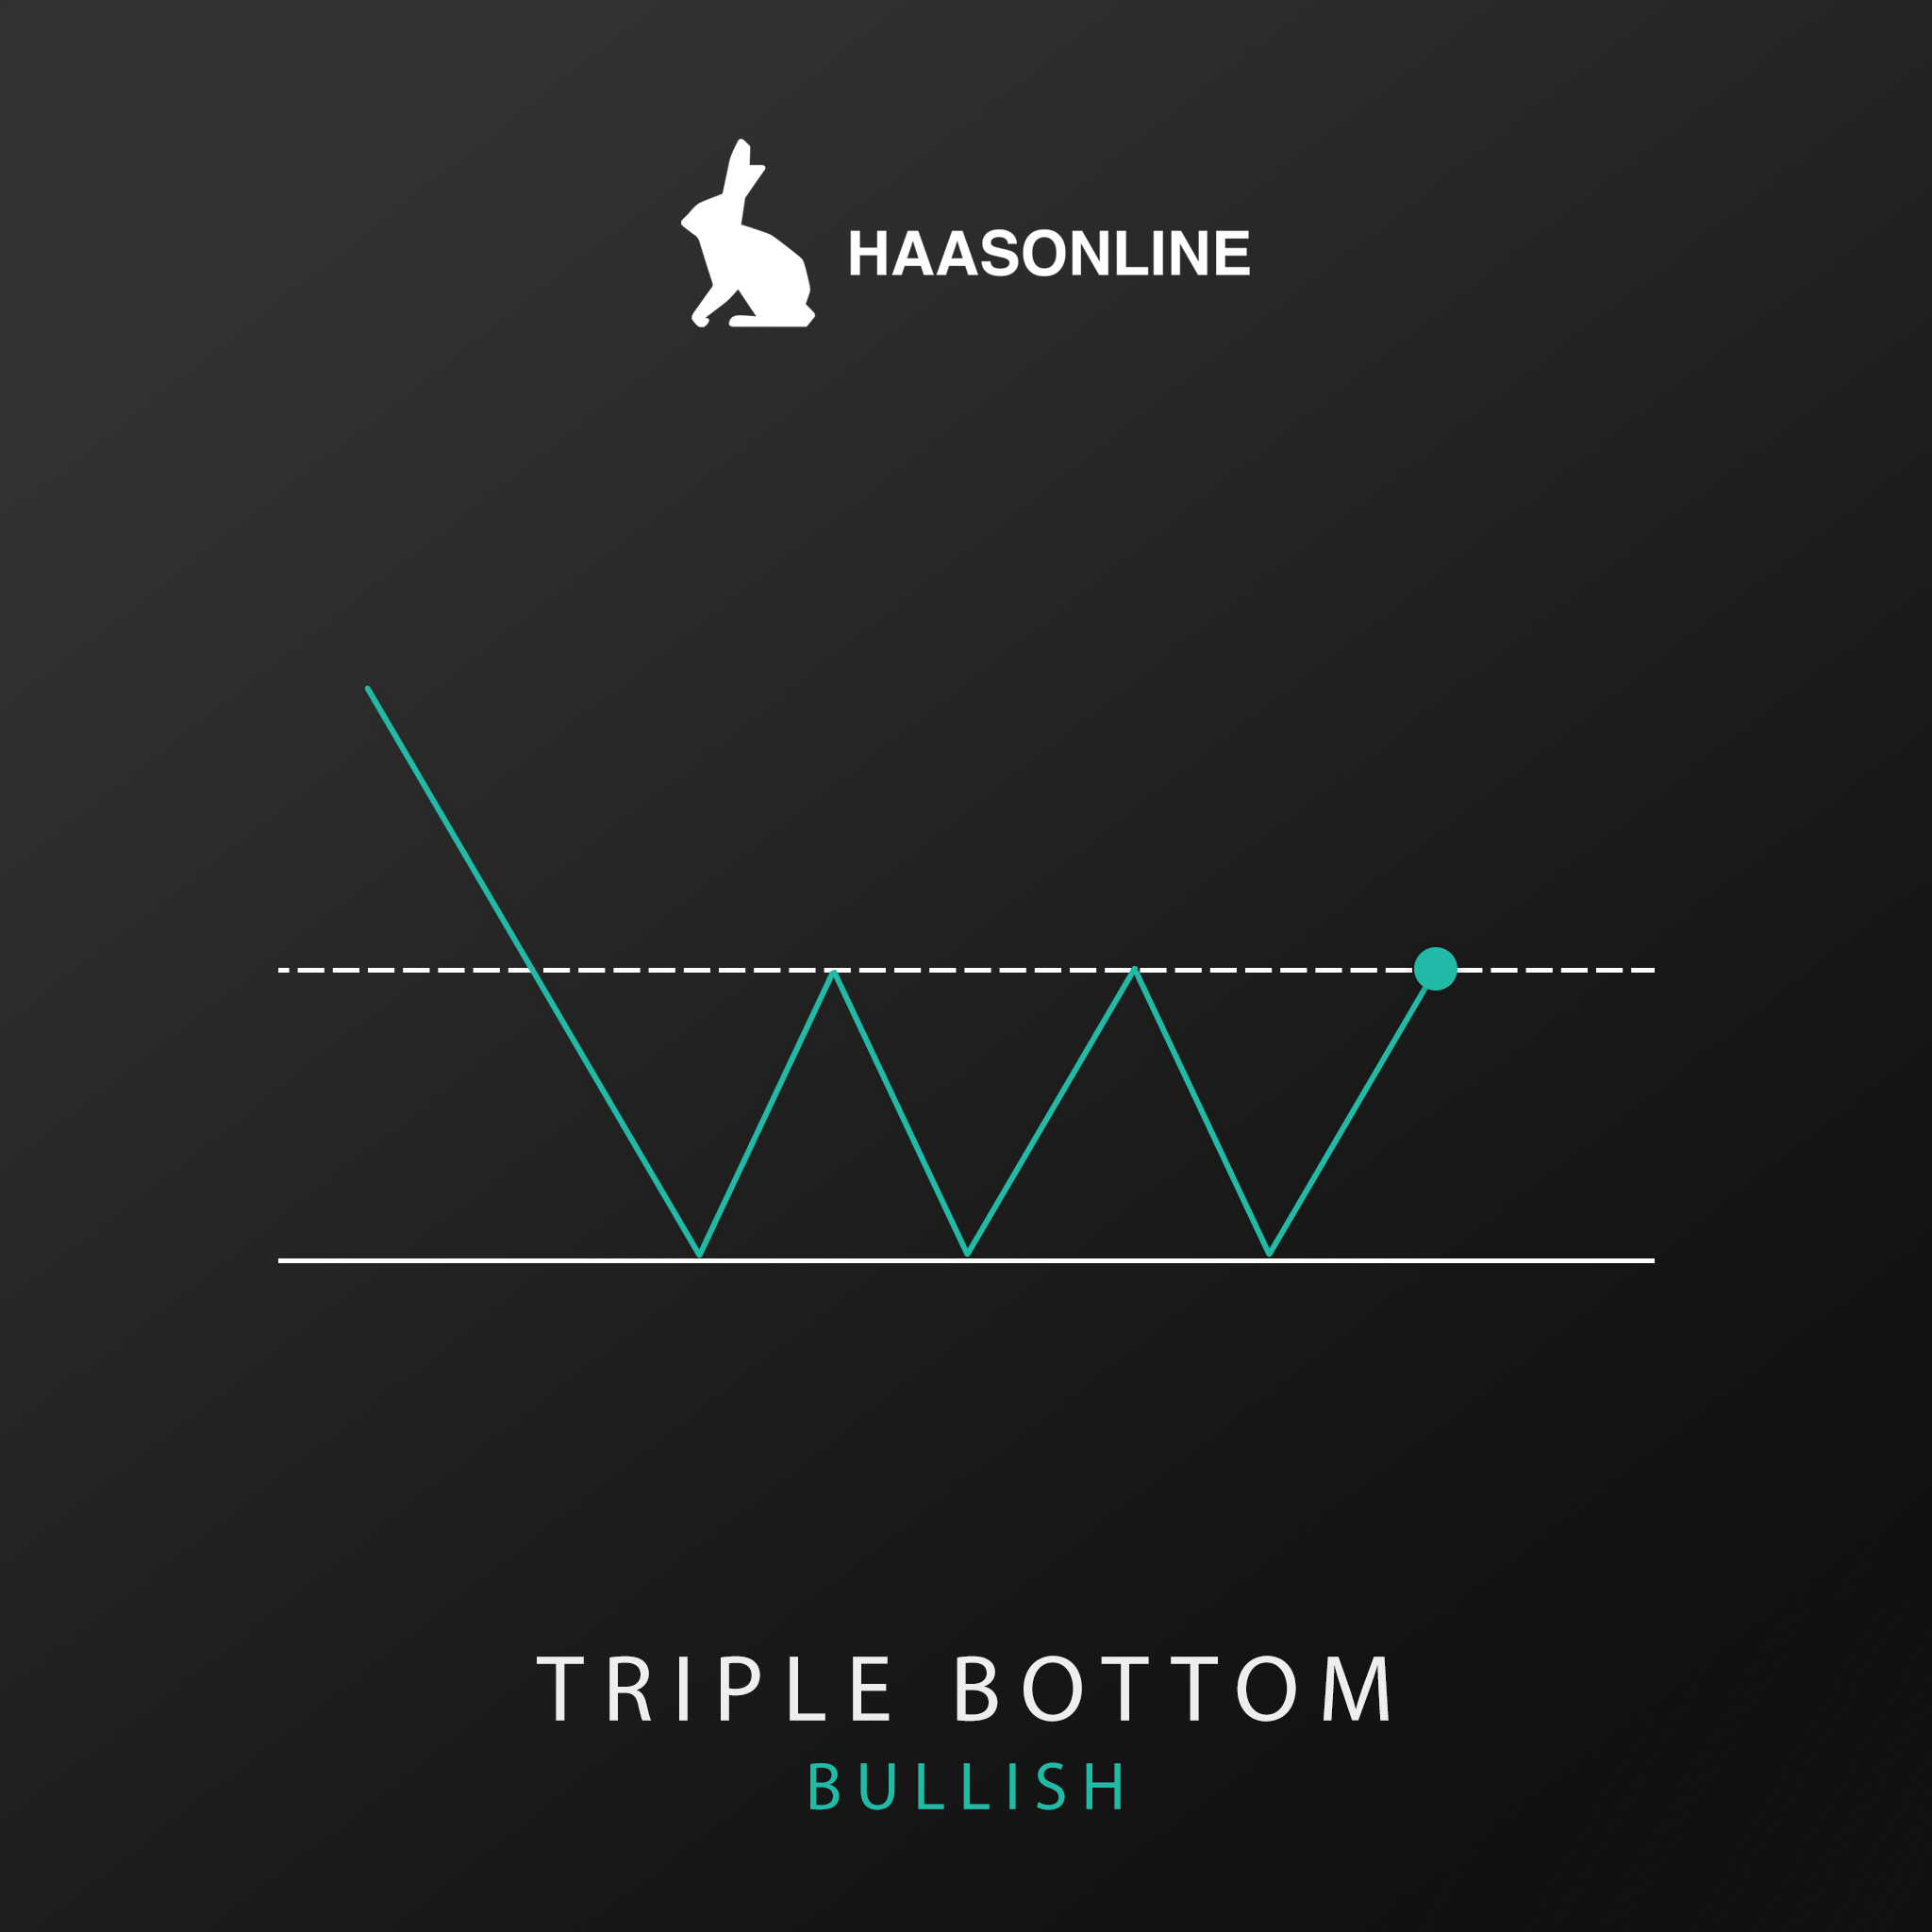
Triple Bottom
The Triple Bottom chart pattern is used as a predictor of a reversal following a long downward trend. It occurs when the price creates three distinct downward prongs near the same supportIn technical analysis, a support line is a price level at which demand for an asset is thought to be strong enough to prevent the... level


