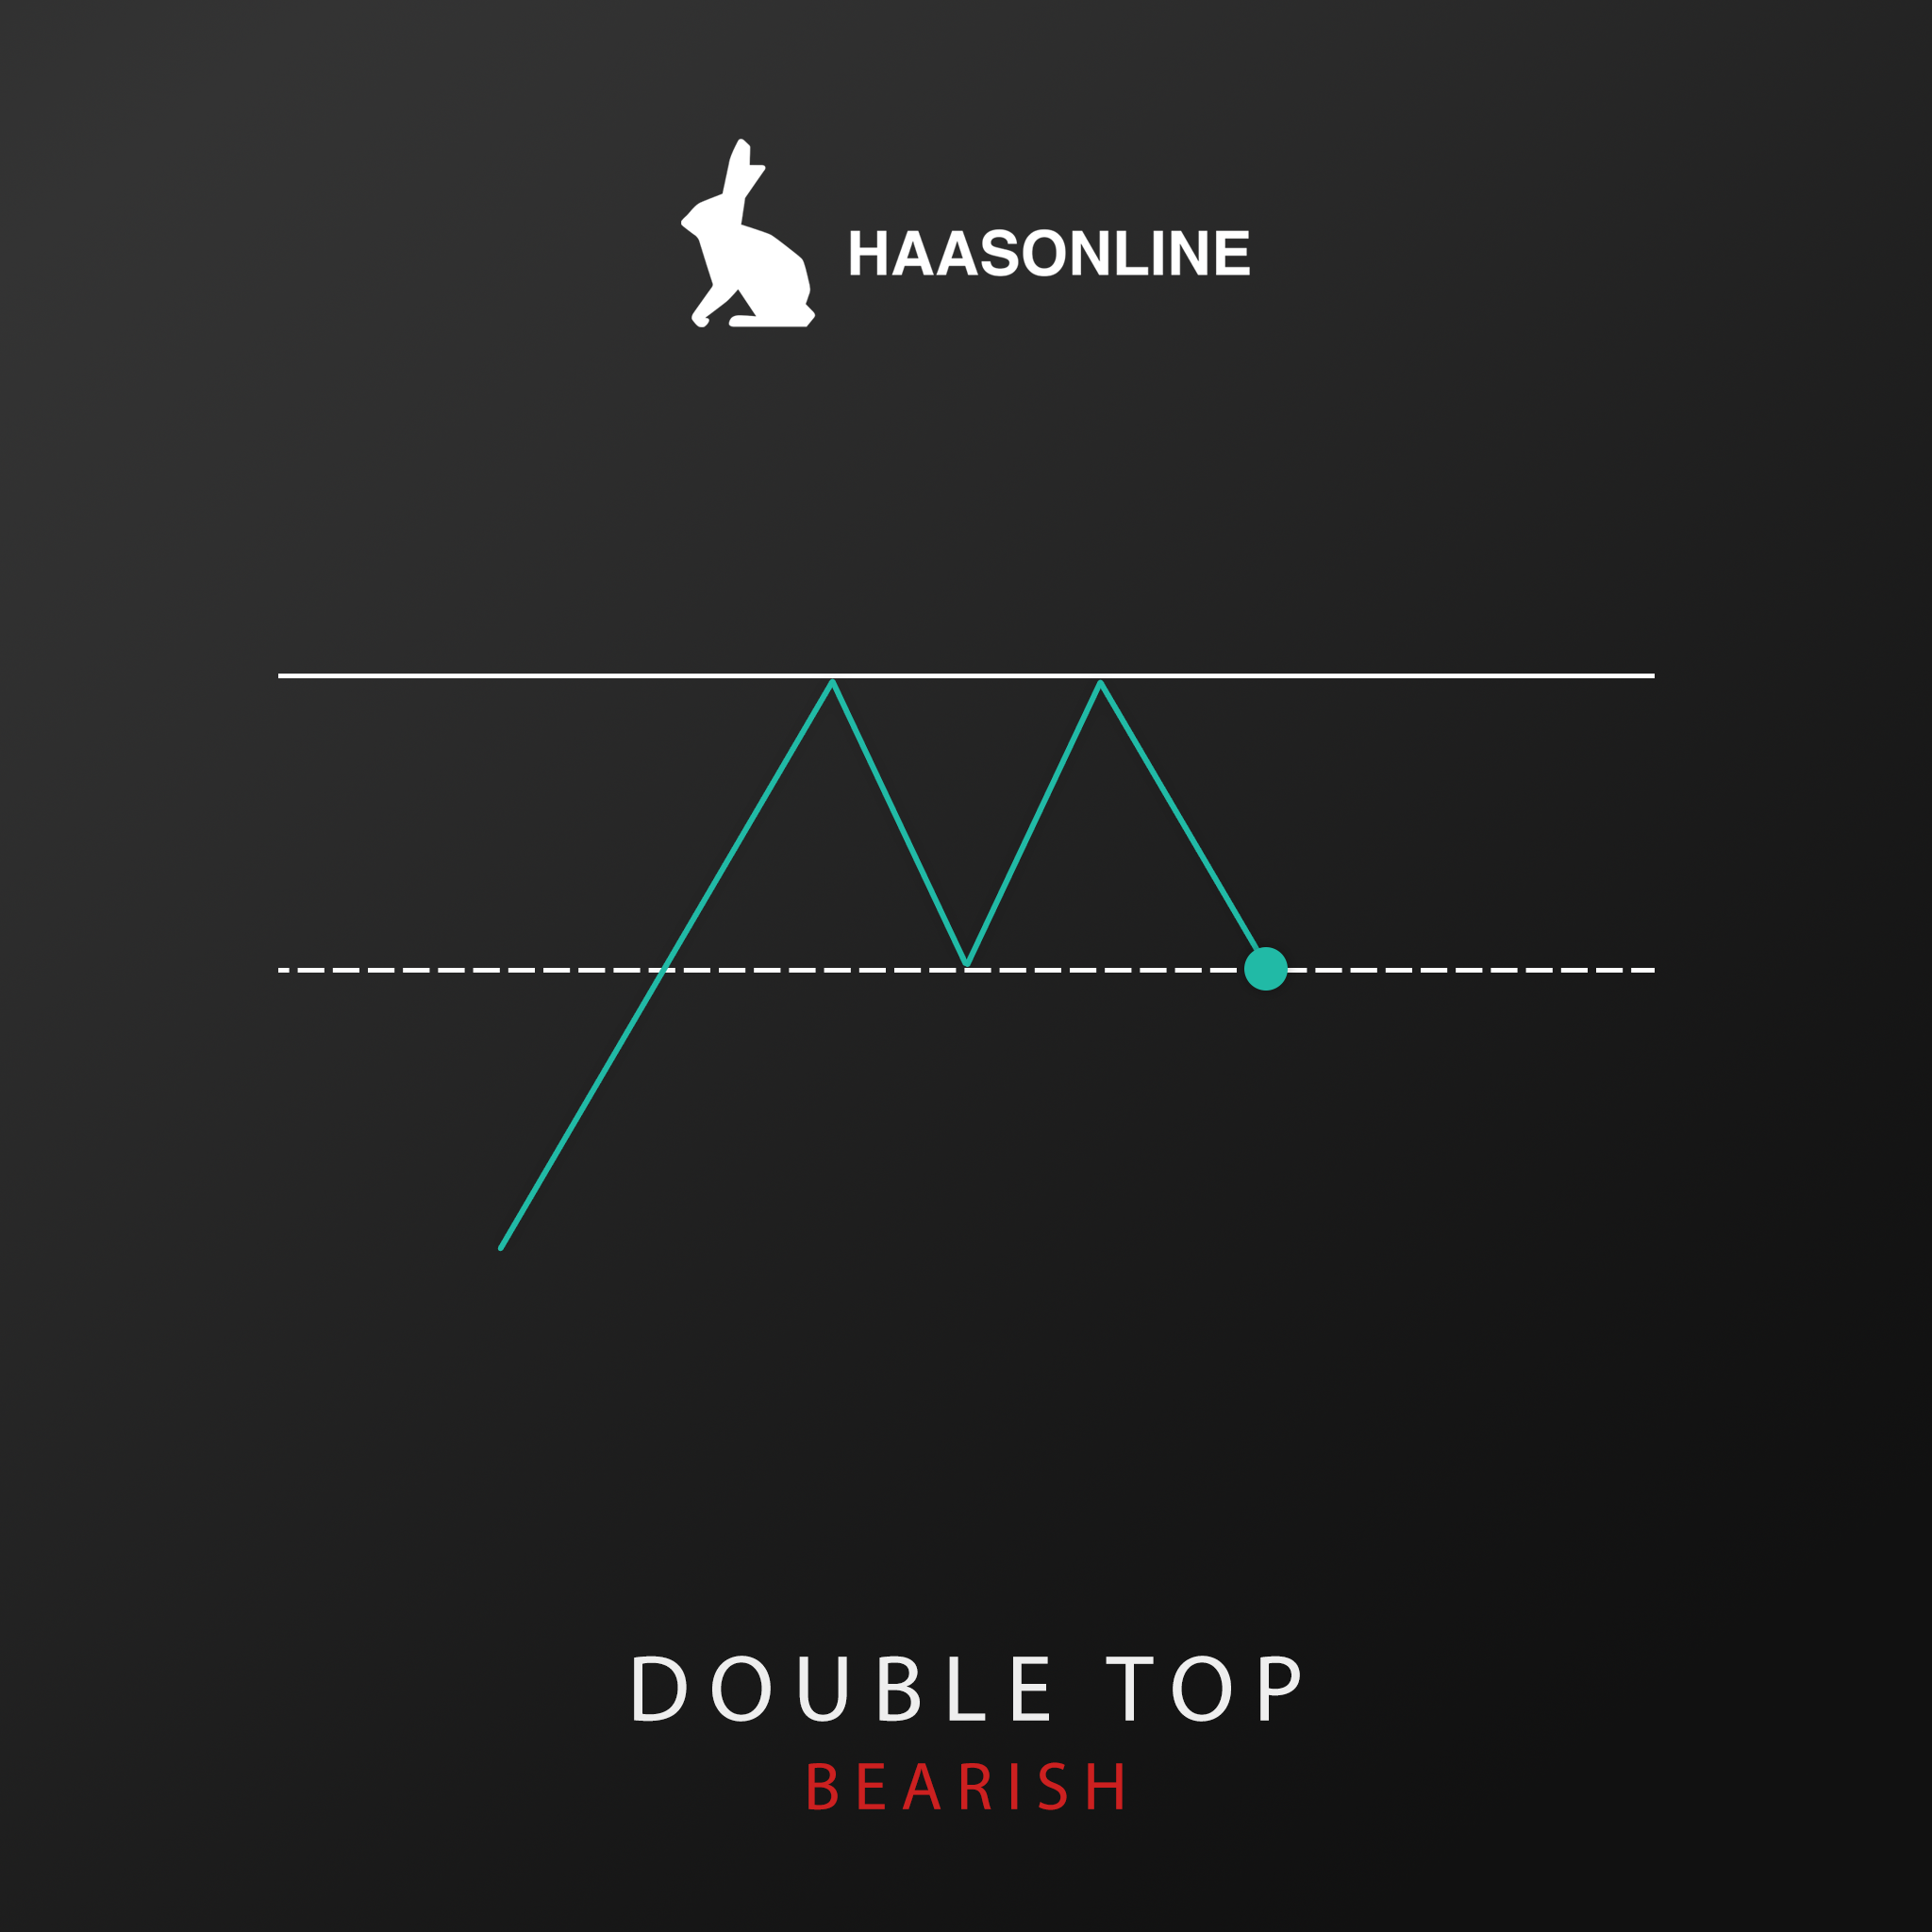
Double Top
The Double Top chart pattern is often looked to as an indicator of a intermediate or long-term price reversal. After a couple of attempts by bulls to push the price above resistanceIn technical analysis, resistance refers to a level on a chart where there is significant selling pressure and the price of an asset struggles to... levels, bulls may capitulate and a bearish market ensues


