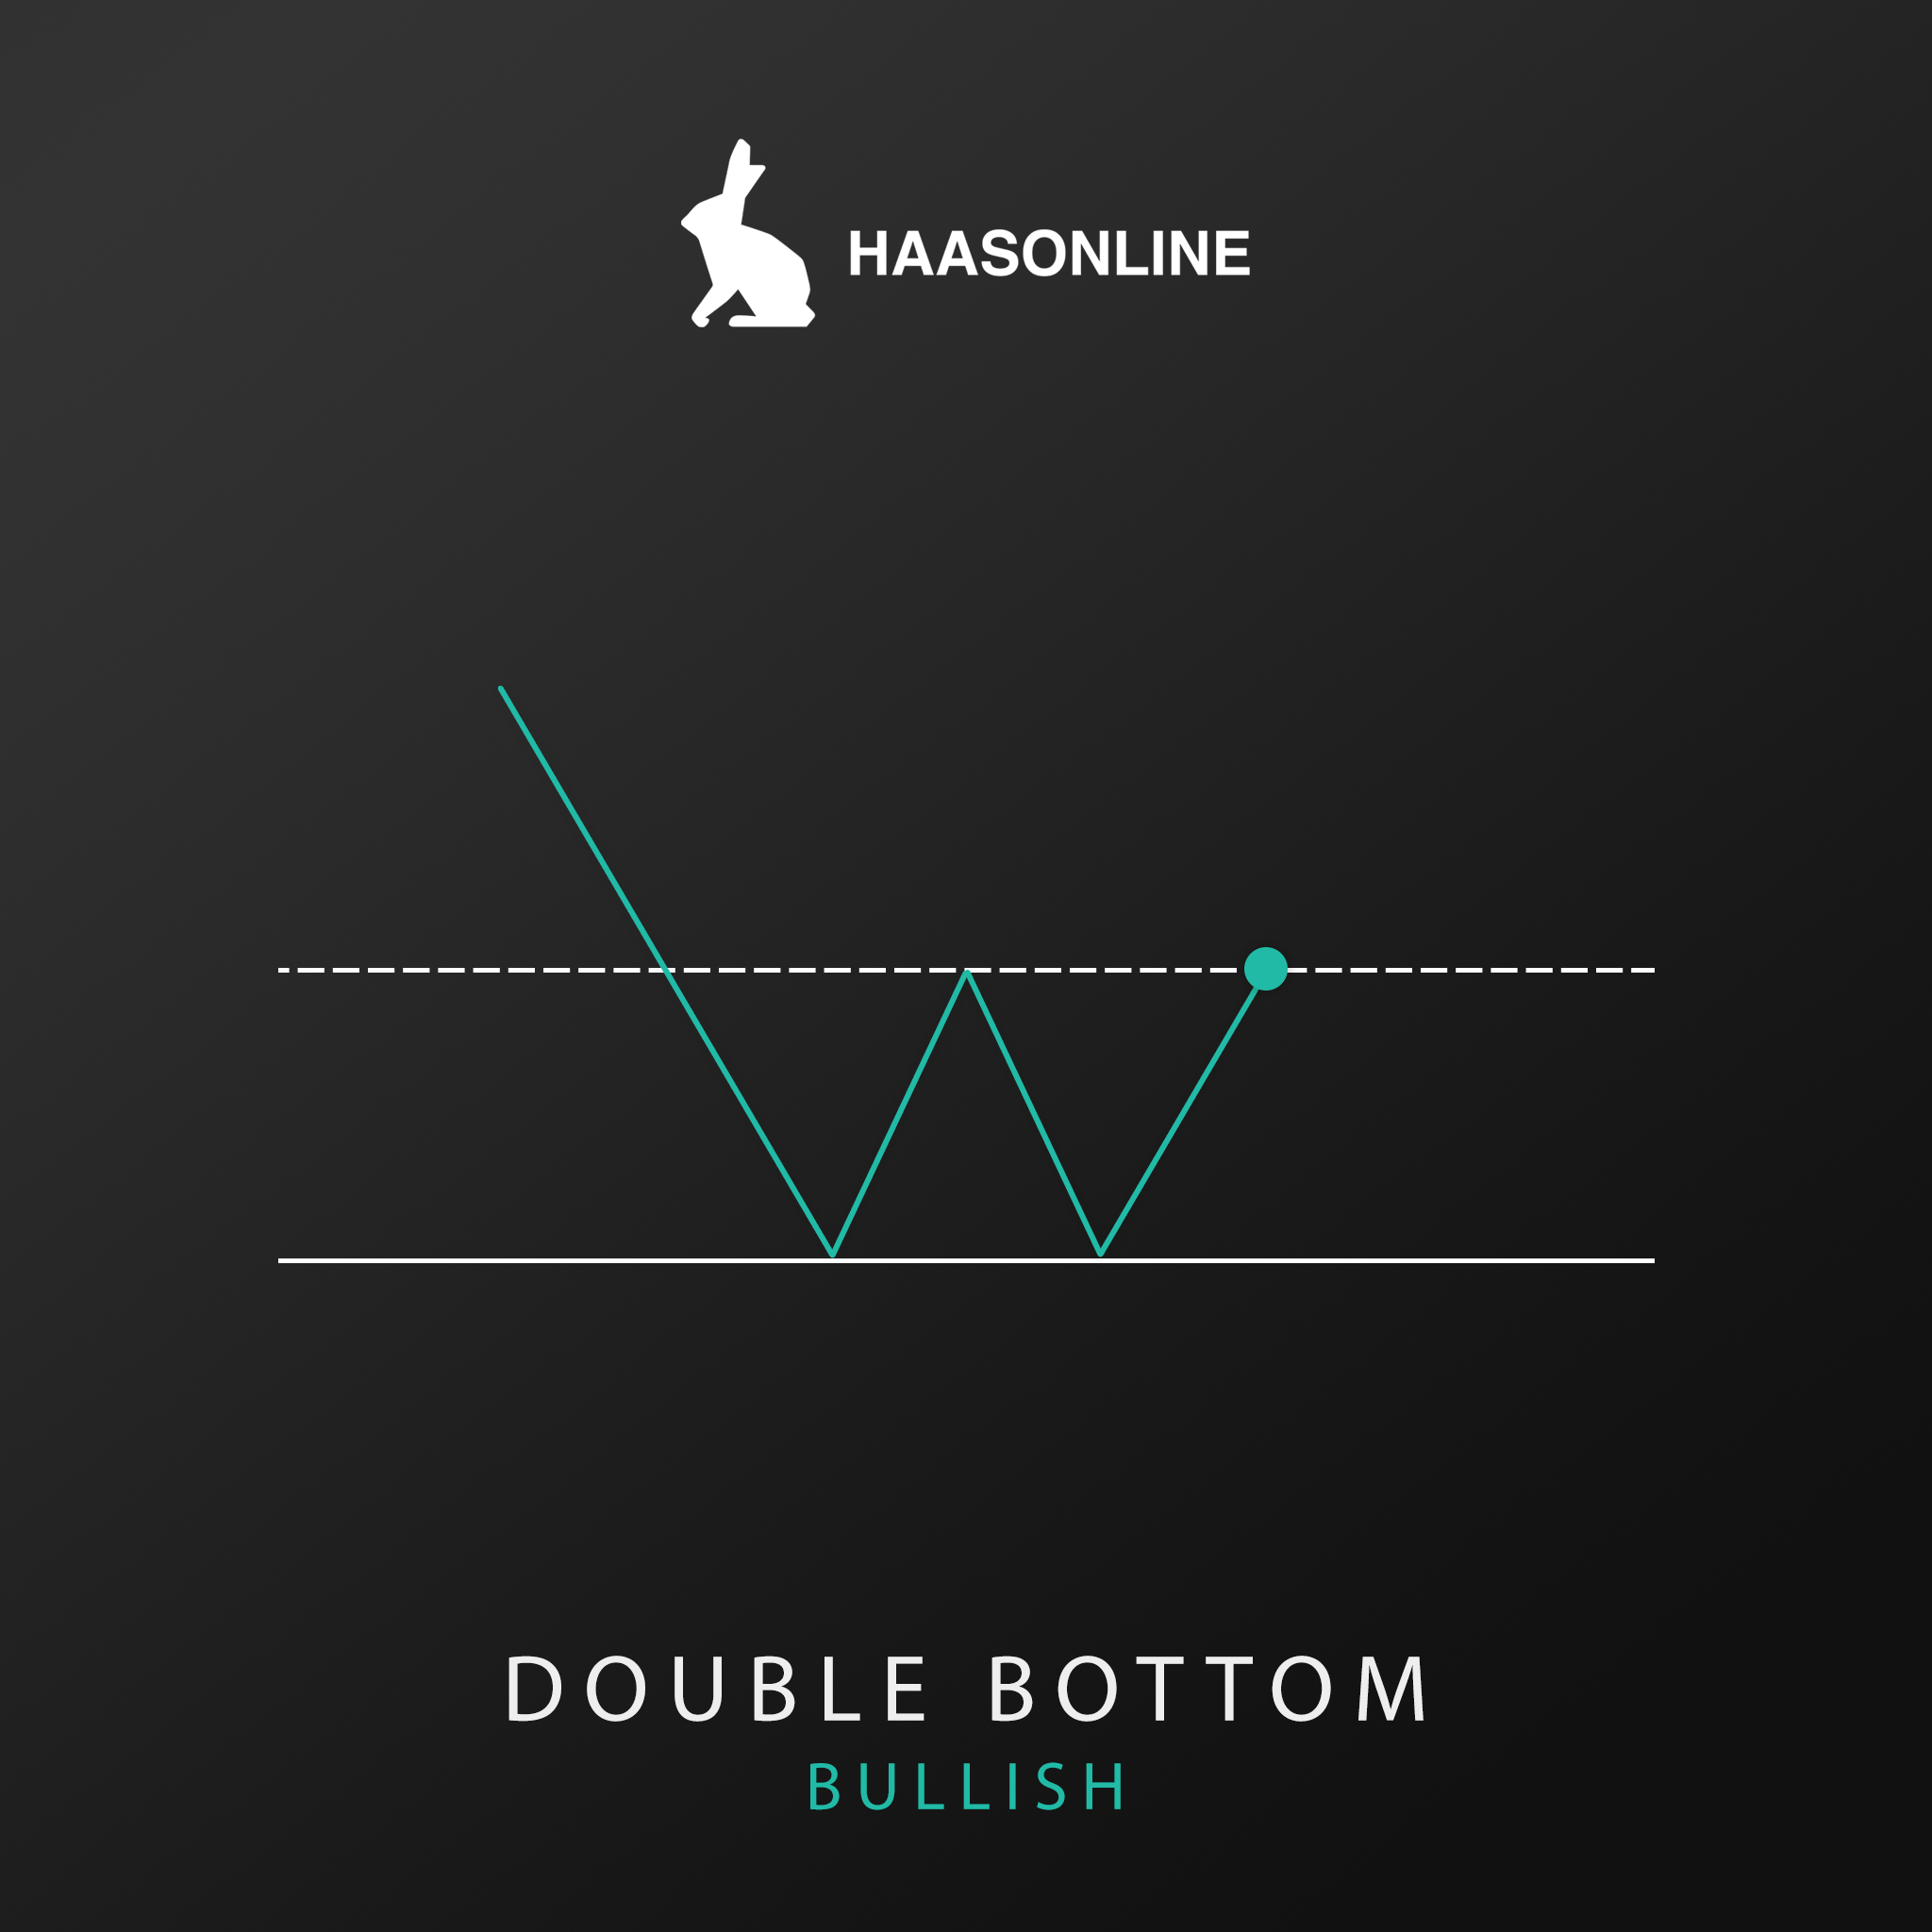
Double Bottom
The Double Bottom chart pattern is used to identify a change in trend and momentum reversal from a prior price actionAs a trader, price action refers to the movement of the price of a cryptocurrency over time. It's the study of how the price changes.... With the signature twice-touched low supportIn technical analysis, a support line is a price level at which demand for an asset is thought to be strong enough to prevent the... level resembling the letter W


