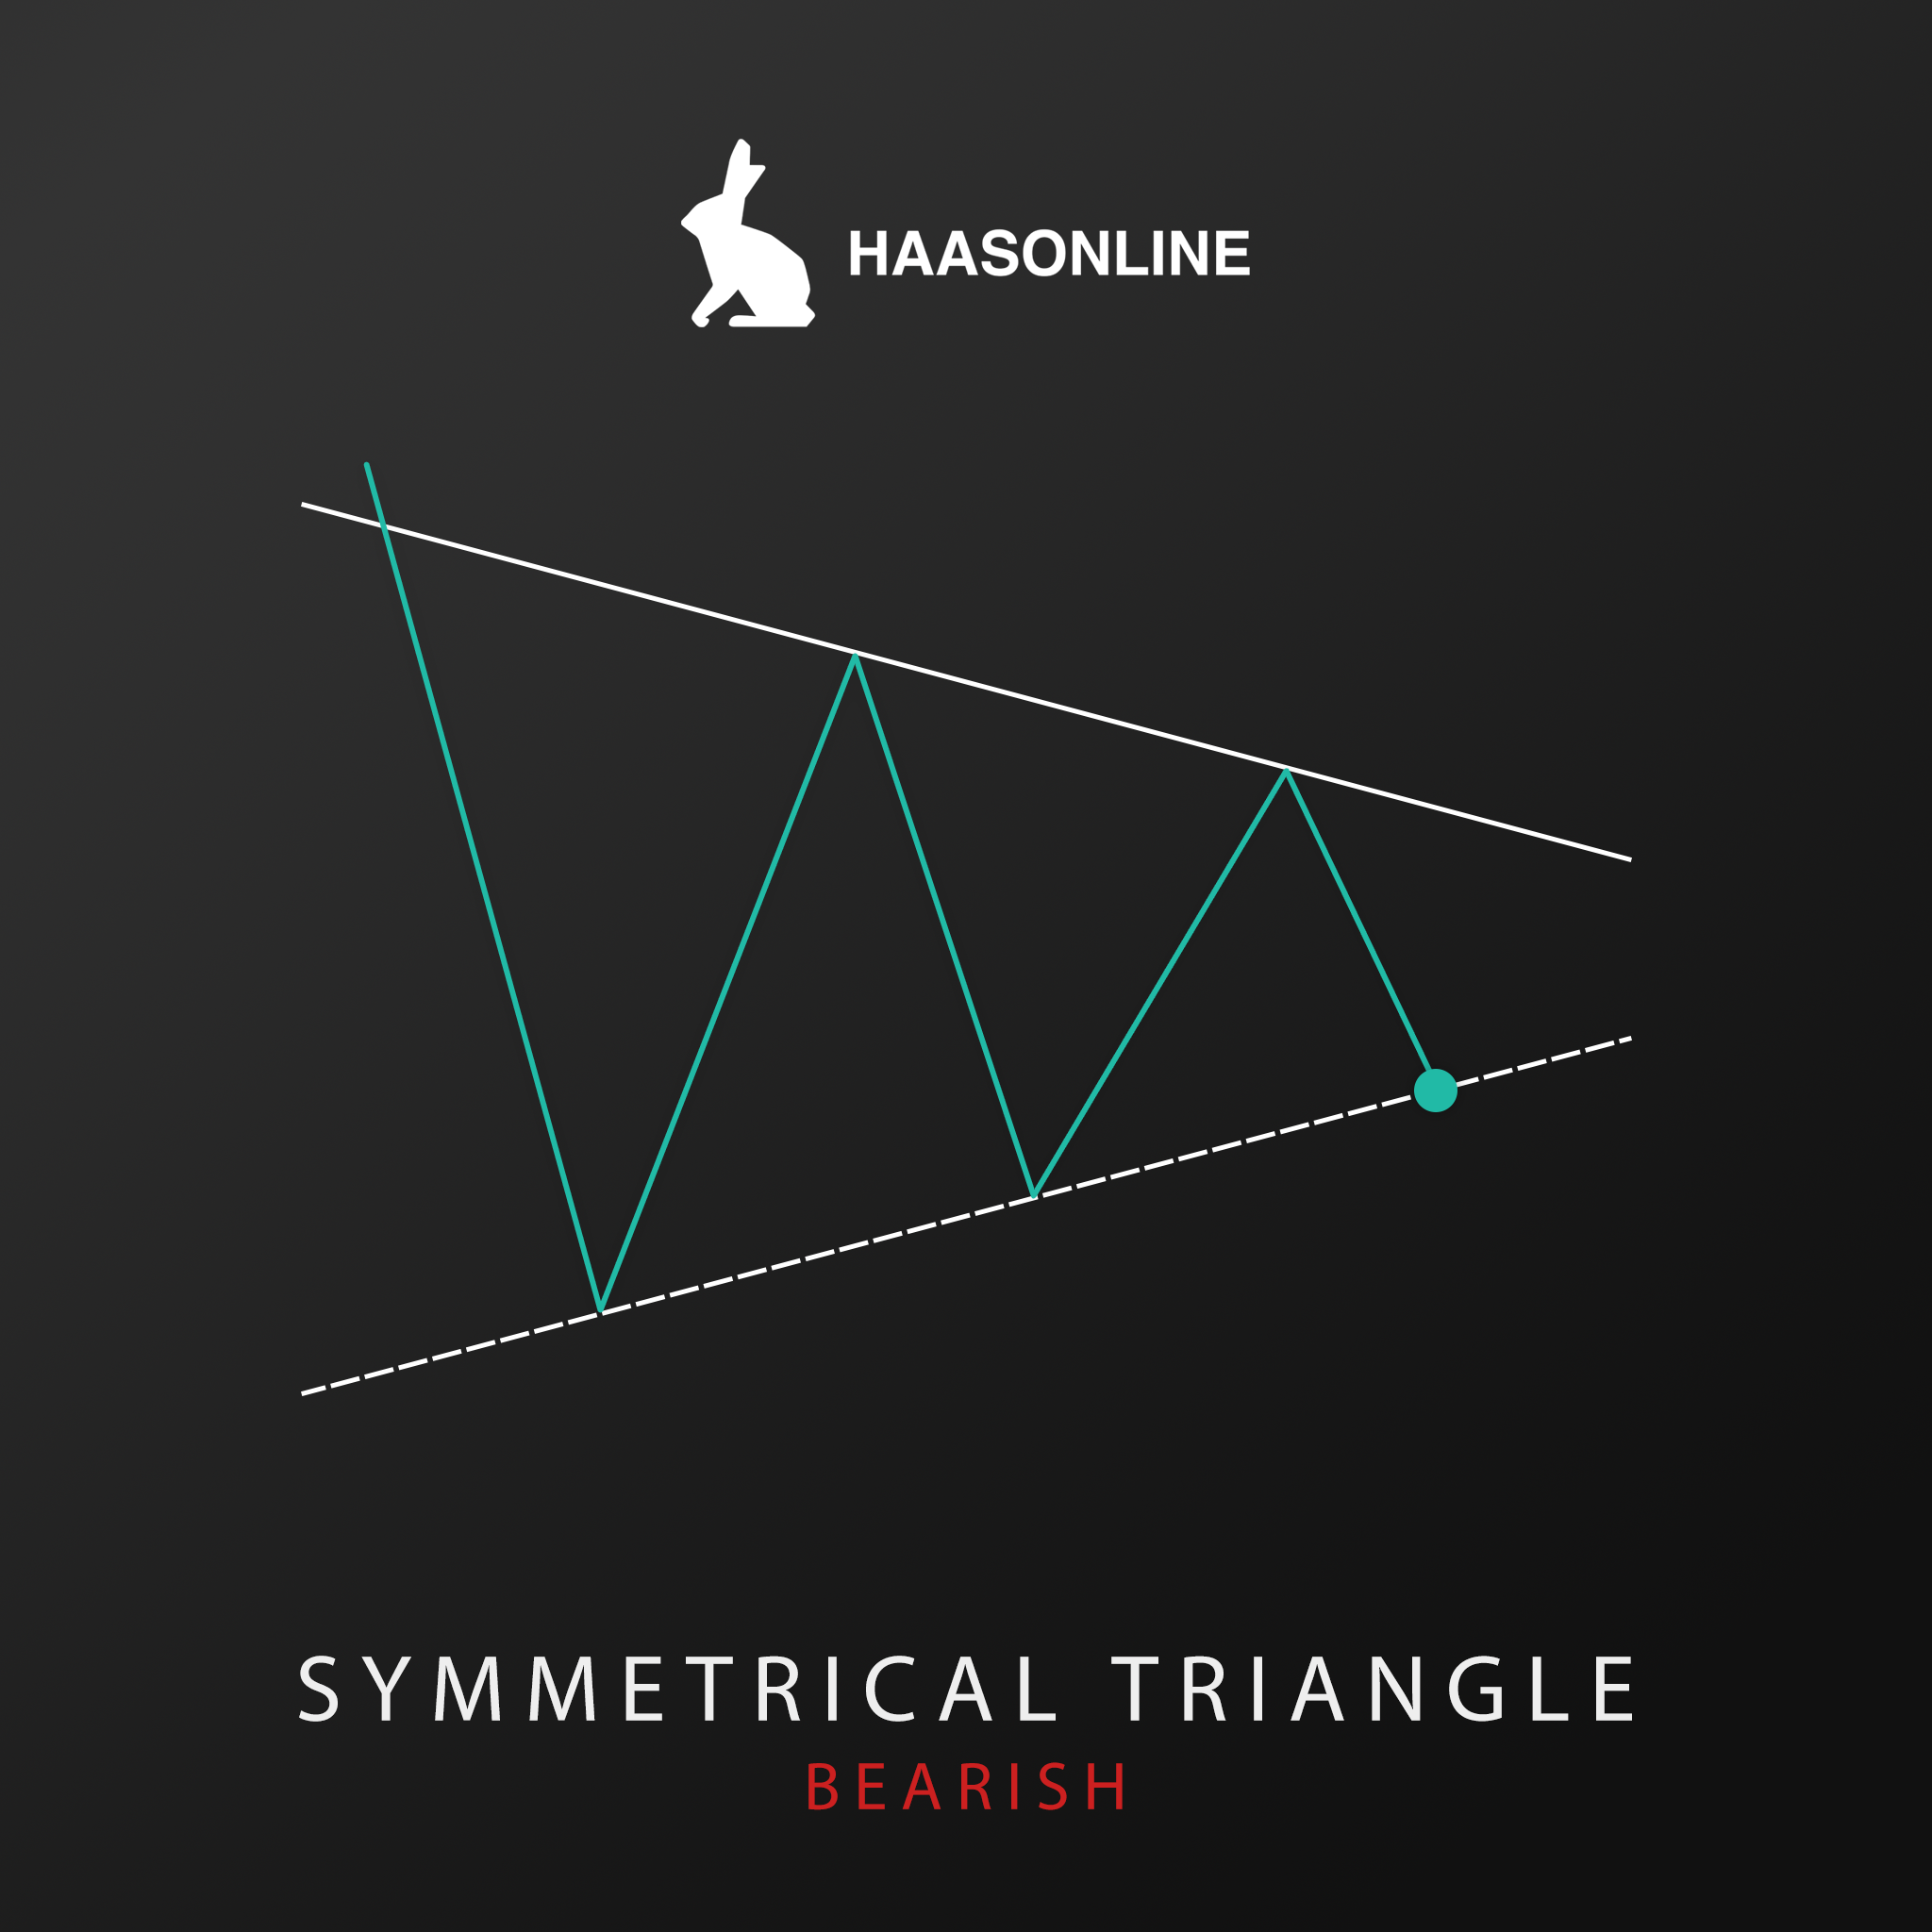
Bearish Symmetrical Triangle
The Bearish Symmetrical Triangle chart pattern again is quite is to spot due to its shape with the peaks and troughs connecting the converging trendlines. Once the price breaks through the supportIn technical analysis, a support line is a price level at which demand for an asset is thought to be strong enough to prevent the... levels, there is usually very sharp price movement


