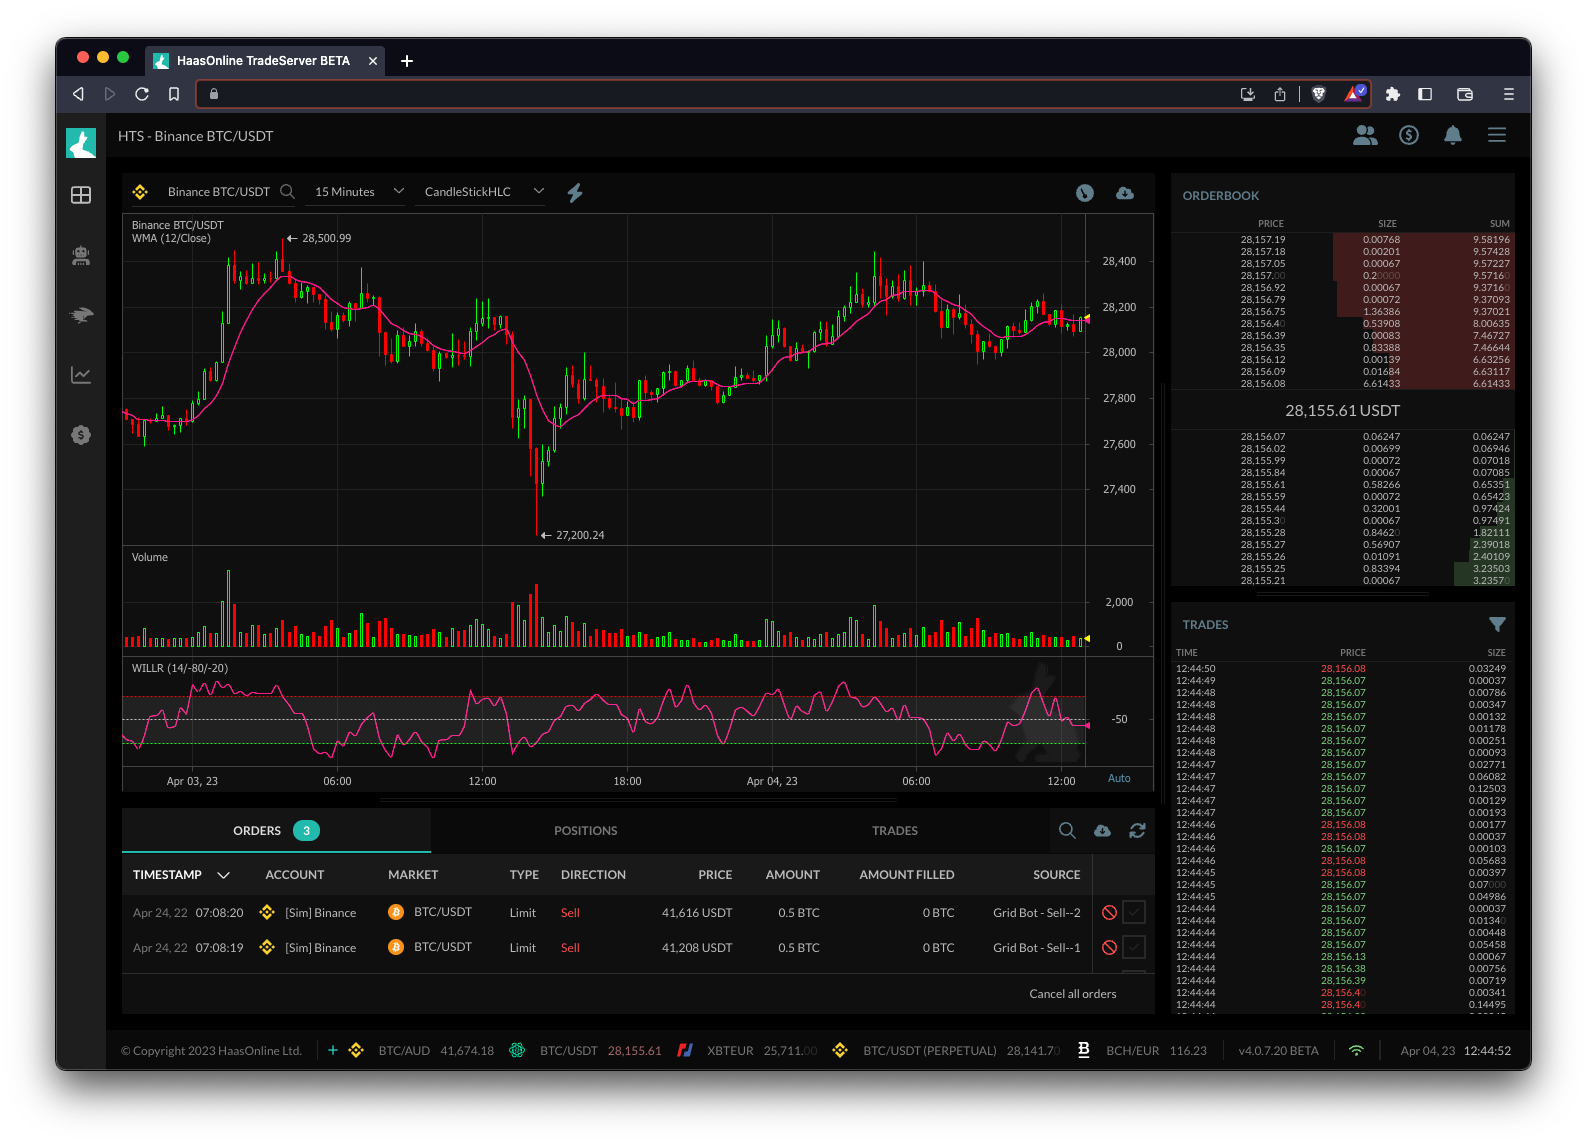
Bollinger Bands
Bollinger Bands is a technical indicator that consists of three lines plotted on a price chart. The middle line is a simple moving average (SMA), while the upper and lower bands are plotted at a certain distance away from the SMA. The distance of the bands from the SMA is based on the standard deviation of the price over a given period.
The Bollinger Bands can be used by trading bots like HaasOnline to identify the volatilityVolatility is a common characteristic of cryptocurrency markets, meaning that the prices of cryptocurrencies can fluctuate rapidly and unpredictably over short periods of time. This... More of a market. When the market is highly volatile, the bands will be wider apart, indicating that prices are fluctuating rapidly. Conversely, when the market is less volatile, the bands will be closer together, indicating that prices are more stable.
Traders can use the Bollinger Bands in a variety of ways, such as identifying potential buy or sell signals. For example, when prices approach the upper band, it may be a sign that the market is overbought and due for a reversal. Conversely, when prices approach the lower band, it may be a sign that the market is oversold and due for a rebound.
By using trading bots like HaasOnline that incorporate the Bollinger Bands indicator, traders can automate their trading strategies based on these signals. For example, a bot could be programmed to enter a long position when prices touch the lower band and exit when prices touch the upper band. This can help traders take advantage of market volatility and potentially increase their profits.